

Reading the Volumes
(In the pulmonary function laboratory)
Reference ranges.
Hemoglobin, adult, g/l. Female 120-156, male 138-172.
Carboxyhemoglobin. Less than 2%.
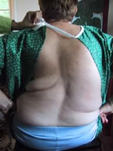
Mrs A, Mrs B and Dr C are in the pulmonary function testing room. Mrs A, aet. 48, has scoliosis, a rotational deformity of the spine. She is planning to have an orthopedic procedure requiring general anesthesia, and the anesthetist has requested evaluation of her pulmonary function. Mrs B, 38, has been referred for investigation of gradually increasing shortness of breath with exertion. Dr C, 28, has volunteered to act as a normal control. Each of them is well in other ways and none of them smokes.
Weights and heights are, respectively (kg:m): Mrs A, 58:1.7; Mrs B, 82:1.65; Dr C, 72:1.7.
* Calculate their BMI (kg/m2).
* Could these have any significance in the present setting?
Results from blood tests arranged the previous day are as follows. Hemoglobin (g/l) Mrs A, 145; Mrs B, 155; Dr C, 135.
* Suggest interpretations of these values from a respiratory perspective.
Carboxyhemoglobin (percentage of hemoglobin): Mrs A, undetectable; Mrs B, 12; Dr C, 4.
* What does COHb indicate?
* Suggest interpretations of these values.
Peak flow testing for Dr C. gives 320, 410 and 420 l/min.
* What are advantages and disadvantages of this test?

Using a spirometer, forced expiratory volume in 1 s. (FEV1) and forced vital capacity (FVC) are measured with the following results (shown above). FEV1 (litres) Mrs A, 2.7; Mrs B, 1; Dr C, 4. FVC (l) Mrs A, 3; Mrs B, 3; Dr C, 5.
* Calculate the FEV1/FVC ratio for each person and comment on the findings.
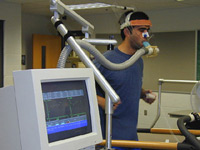
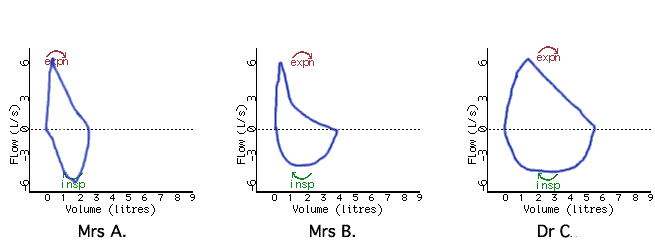
Using a pneumotachograph, rate of airflow is measured during quiet breathing and gas volumes are calculated. The subjects are asked to exhale forcefully from maximum inspiration, then to inhale again to vital capacity, which is the origin in these recordings. The plotted flow/volume loops are as follows.

* Which points on these loops represent Vital Capacity and Residual Volume?
* Could Peak Flow and Vital Capacity be obtained from these flow/volume curves?
The expiratory part of the loop has an asymmetrical course, rising quickly to a high flow rate and then falling slowly.
* Is airway resistance to airflow greater in inspiration or in expiration?
* Why are there two phases in the expiratory flow trajectories?
* Why is this phenomenon more marked in the recording from Mrs B?
* Can you suggest a diagnosis for Mrs B's pulmonary condition?
| * Can you interpret the curve for Mrs A in terms of her condition? | 
Moderate scoliosis picture: Richard & Debra Austin |
Details about the metacholine challenge test from 'Statpearls'.
A good general review of respiratory physiology can be got by browsing through the 24 brief items in the Johns Hopkins School of Medicine's Interactive Respiratory Physiology Encyclopedia.