Clinical Problems in Respiratory Physiology
Demonstrators' Notes

A No-show and a Mismatch.
none of the specific formulae or data given in this case is examinable in
this course
abbreviations.
a, arterial; A, alveolar; B, barometric (i.e. of the atmosphere); C02, carbon dioxide; F, fraction; I, inhaled; mmHg or torr, pressure in millimetres of mercury (torricelli); 02, oxygen; P, partial pressure of a gas; S, saturation (%). Formulae assume partial pressures of gases in mmHg. For kPa multiply by 0.133.
A fifty-four year old man fails to turn up to his bowls game and does not
answer the telephone. Friends from the club enter his flat through the back
door and find him lying on the kitchen floor, unresponsive and breathing
stertorously. The ambulance crew find that his right limbs are floppy and
his Sa02 is 75%. He does not rouse during transport. On examination in
hospital he remains comatose, his right chest is dull to percussion and his
blood white cell count is markedly raised.
His neurological diagnosis
is a cerebrovascular accident (CVA); he has suffered a 'stroke'.
* What respiratory
system problem might be present?
A bacterial pneumonia, causing consolidation of lobes of the lungs, is likely from this story. Loss of consciousness, aspiration of material into the lung and failure of cough may have contributed to this.
* Is he significantly hypoxemic?
Oxyhemoglobin is nearly saturated with oxygen
above a PO2 of around 60 mmHg, so alveolar oxygen higher than this will increase
the saturation very little, and the 'oxyhemoglobin equilibrium curve' is
shallow. At 60 mmHg Pa02 the hemoglobin is about 90% saturated. Below
this region the curve is steep as hemoglobin 'unloads' its oxygen, so
arterial partial pressure values below about 60 mmHg are associated with relatively
rapidly falling SaO2 values. An arterial saturation of 75% indicates a seriously
low PaO2 of about 40 mmHg, equivalent to the normal value in 'mixed venous' blood, after the tissues have extracted their oxygen requirements.
An arterial blood gas (ABG) sample is taken from the radial artery at the wrist. His PCO2 is 65 mmHg. He has marked hypercapnia.
* Is high-dose oxygen dangerous as he might be
insensitive to CO2 and dependent on hypoxemia to drive ventilation?
No, unless
there is reason to believe that he has suffered pre-existing lung disease
sufficient to cause insensitivity to the hypercapnic 'drive' to breathing.
His arterial blood gases (ABG) are not satisfactory even with high-dose inhaled
oxygen.
* What measure could be used to reverse his hypoxia and hypercapnia?
Mechanical ventilation.
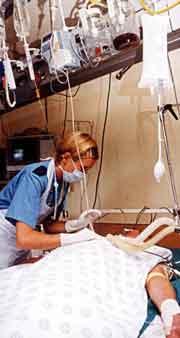
He is thought to be at risk of death from respiratory failure. He is intubated
with an endotracheal tube and mechanically ventilated with 70% oxygen in
the intensive care department. He is nursed lying on his right side and
on his left side alternately with turns at two hourly intervals.
* Why?
Unrelieved body
weight in an unconscious individual is sufficient to cause breakdown of skin
('bedsores') in pressure areas.
His ABG values are noted to vary with his position. The following values
are representative:
Right side up: pH 7.43, PaCO2 32 mmHg, PaO2 123 mmHg
Left side up: pH 7.45,
PaCO2 30 mmHg, PaO2 76 mmHg
* In spite of his condition, his PaO2, at least
in one position, is high. Why is this?
He is receiving oxygen at three
and a half times the normal concentration, and his chest wall movement is not reliant
on muscle action, but is being done by an external pump, which also controls his respiratory frequency.
* His PCO2 values are below normal - his lungs seem to be working 'better
than normal' in this regard. How can this be?
He is being 'hyperventilated' - i.e.
the ratio of carbon dioxide removal to its production is greater than normal.
The function of the lungs as a whole-at least the oxygen transport function-can be summarised in a single number; the difference in partial pressure of oxygen between the alveolar gas ('A') and the arterial blood ('a'). This is known as the "alveolar-arterial gradient for oxygen" (say "Aa gradient" or "Aa difference"). Appendix I gives a derivation of this value and in Appendix II a clinical shortcut is shown.
* What is the A-a difference for a healthy subject breathing room air (21% oxygen) with a PaCO2 of 40 mmHg and a PaO2 of 97 mmHg? Calculate this using either the long form (appendix I) or the shortcut (appendix II). If time, obtain both answers and consider whether the shortcut is valid.
By the long method:
Working from the formulae given in Appendix I, the A-a difference is obtained as follows;
P(A-a)O2 = (PB - PH20) X FI02 -PaCO2/R + f - PaO2
Substituting appropriate values;
(760-47) * 0.21 - (40/0.8) + 2 - 97 = 2.73 mmHg i.e. approximately
3 mmHg
By the shortcut:
The formula given in Appendix II gives;
P(A-a)O2 = [710 X FI02] - [PaCO2 X 1.25] - PaO2
Substituting;
(710 * 0.21) - (40 * 1.25 ) - 97 = 2.1 mmHg i.e. approximately
2 mmHg
Predicted value:
Using [age/3] - 3 mmHg from Appendix II;
20/3 - 3 = 3.7 mmHg i.e. approximately 4 mmHg
For the two positions in which the patient is nursed, the A-a diffence is calculated as follows.
Right side up: FI02 0.7, PaCO2 32 mmHg, PaO2 123 mmHg:
(760-47) * 0.7 - (32/0.8) + 2 - 123 = 338.1 mmHg
Left side up: FI02 0.7, PaCO2 30 mmHg, PaO2 76 mmHg:
(760-47) * 0.7 - (30/0.8) + 2 - 76 = 387.6 mmHg
* How does the Aa difference in this patient compare with the value expected at his age?
It is very much increased in both positions, and worse when he is "left side up".
So, gas exchange is better when the patient is "right side up", with the pneumonic right lung ('consolidated', by alveolar filling with neutrophils and bacteria) uppermost, and the aerated left lung dependent (downwards).
* If the improvement in oxygen transfer in the dependent position is due to the matching of ventilation (of the alveoli, by gas) with perfusion (of the capillaries, by venous blood), can you suggest a reason why the arterial oxygenation is better when the aerated lung is dependent?
 An increased P(A-a)O2 is usually caused by a 'ventilation-perfusion mismatch'. This means that regions in which alveoli are well ventilated do not coincide with regions
in which alveoli are well perfused with venous blood. Refer to Dr Ellyett's
lecture on "Gas Exchange". When ventilation (V) and perfusion (Q) are matched with each other,
their ratio (V/Q) will approach a fixed value close to 1. If either
is reduced, the ratio will move away from this.
In this case the ventilation of the diseased (right) lung is severely reduced
by pneumonia, in which the alveoli are filled with bacteria, inflammatory
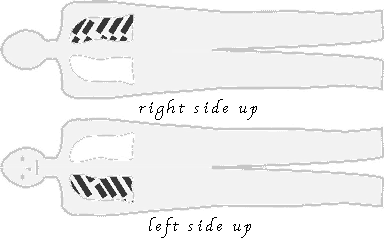
cells and transudate. Therefore, although it is perfused with blood, the diseased lung (indicated with diagonal bars in the figure to the left) contributes little to
gas exchange whether in the elevated or dependent state. The ratio of V to Q is low.
The patient's ventilation is reliant on his healthy left lung. Blood
flow is greater in dependent (downward) than in elevated regions due to gravity. When the patient is
laid with his right side up, the healthy lung is dependent (upper outline in figure). In this location it has both good ventilation and good perfusion, so V and Q are
balanced and oxygen transfer is improved. He is well oxygenated with a PaO2 of 123 mmHg in spite of an overall P(A-a)O2 of 338.1 mmHg.
When the patient is lying the other way, with the healthy lung elevated ('left
side up'; lower part of figure), the blood flow through that lung is reduced (particularly if his blood pressure is low, as was the case here). The ventilation/perfusion ratio (V/Q) of the lung
is therefore above normal and oxygen transfer is reduced. His P(A-a)O2 is worse at 387.6 mmHg, and his arterial oxygenation falls to a low PaO2 of 75 mmHg in spite of the mechanical ventilation.
In summary, the diseased lung has a low ratio of ventilation to perfusion in either position. When the healthy lung is uppermost its V/Q ratio is above the optimum: this ratio improves towards normal with the increase in perfusion when he is "right side up", and oxygen transfer increases.
 * Although hypoxemia is a problem when he is left side up, why isn't hypercapnia also a problem in this position?
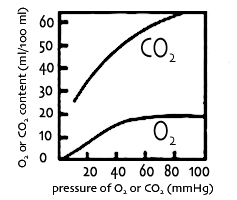
A V/Q mismatch affects oxygen transport more than CO2 transport. For oxygen, its main means of carriage, by hemoglobin in erythrocytes, reaches a maximum when the hemoglobin is fully oxygenated, i.e. saturated. This 'ceiling' effect can be appreciated from inspection of the oxyhaemoglobin equilibrium curve (see figure to the right, lower curve). Therefore our patient's one functioning lung, with its better V/Q ratio, is limited in the amount of oxygen it can transfer to the blood which leaves that lung, and this blood draining from this higher V/Q area cannot correct for the hypoxemic blood draining from his other lung, a low V/Q area.
For carbon dioxide on the other hand, carried mainly as bicarbonate ions in solution, the content in blood is more simply and directly related to its partial pressure (upper curve in figure on right). The increased ventilation provided by the machine allows CO2 transfer from the pulmonary blood without the restriction of a 'ceiling' in the content of gas in the blood. Our patient's functioning lung transfers to the airways almost all the CO2 delivered to it and contributes hypocapnic blood to the pulmonary veins, more than compensating for the hypercapnic blood draining from the consolidated lung with its low V/Q ratio. His arterial PaCO2 remains low.
The alveolar-arterial gradient has been used here to study lung function. In practice it can be used to distinguish problems in the lung (increased Aa difference; hypoxemia is due to V/Q mismatch) from problems with ventilation (normal Aa difference; hypoxemia is due to central hypoventilation or a chest wall problem).
Appendix I. The Alveolar-arterial Gradient for oxygen.
The alveolar-arterial gradient for oxygen (in spoken form, the "Aa gradient" or "Aa difference") allows the function
of the lungs in transferring oxygen from air to blood to be expressed in
a single figure (expressed as mmHg, i.e. as a pressure difference). The first step in calculating this (the alveolar gas equation) takes into account
the reduction in PO2 in the lungs (compared with the oxygen in the inhaled
gas) caused by the presence of carbon dioxide in the lungs.
The Alveolar Gas Equation.
PA02 = PI02 -PaCO2/R + f
where:
f is a correction factor: assume that
f = 2 mmHg.
R is the 'respiratory exchange ratio', indicating the ratio of carbon
dioxide produced to oxygen consumed and arising from the action of cellular
respiration, and is somewhat variable with diet. Assume R = 0.8.
PI02, the partial pressure of inhaled oxygen, is obtained from the pressure
of atmospheric gas, the water vapour pressure, and the oxygen fraction of
the inspired gas, by the following formula
PI02 = (PB - PH20) X FI02
where: PB is barometric pressure, which varies with temperature, height
above sea-level and the weather. For this exercise use the barometric pressure
standard of 760 mmHg.
PH20, the water vapour pressure, is the "humidity" of the gas. This depends on the water saturation and the temperature. At normal body temperature the inhaled gas is fully saturated with water in the upper airways and PH20 is 47 mmHg.
FI02 is the fraction of oxygen in the inspired gas mixture. Room air is 21/100
or 0.21; gas administered by mask or by machine may exceed this.
The Alveolar-arterial Gradient (Aa gradient) for oxygen.
P(A-a)O2 = PA02 - PaO2
where: PAO2 is obtained from the alveolar gas equation and PaO2 from arterial blood gas results. |
Appendix II. A Shortcut for the A-a difference.
In clinical practice shortened forms of equations are often sufficient for
everyday tasks. Here is an abbreviated version of the alveolar gas equation used at the Middlemore Hospital Emergency Department (source, Wayne Hazell. Emergency medicine at your fingertips. Roche Auckland 1998; p. 30):
PAO2 = [710 X FI02] - [PaCO2 X 1.25]
Alveolar-arterial oxygen gradient P(A-a)O2 = PAO2 - PaO2
Normal value
= [age/3] - 3 mmHg
|
Note.
The actual value is around 0.8. (return to text)
Recommendations for further reading.
Lawrence Martin is a doyen of respiratory physicians and writes entertainingly on many subjects. His notes on pulmonary physiology (and other topics) are available at his site but more reliably here through the Wayback Machine. See for example "PaO2, SaO2 and Oxygen Content" from his handbook, "All You Really Need to Know to Interpret Arterial Blood Gases" (mirrored here) and "The four most important equations in clinical practice" (all from respiratory physiology!), also usefully summarised at the start of this page ("Hardcore" - mirrored here). Parts of his book "Pulmonary Physiology in Clinical Practice: The Essentials for Patient Care and Evaluation" are readable online as well. [links valid June 2005]
(case based on a problem by Lawrence Martin. Thanks to Dr Stewart Robinson for comments. The figure illustrating equilibrium curves for O2 and CO2 is based on Fig. 52A of John West, Respiratory Physiology 1974.)


Corrections and suggestions to D de Castro please.
 An increased P(A-a)O2 is usually caused by a 'ventilation-perfusion mismatch'. This means that regions in which alveoli are well ventilated do not coincide with regions
in which alveoli are well perfused with venous blood. Refer to Dr Ellyett's
lecture on "Gas Exchange". When ventilation (V) and perfusion (Q) are matched with each other,
their ratio (V/Q) will approach a fixed value close to 1. If either
is reduced, the ratio will move away from this.


 * Although hypoxemia is a problem when he is left side up, why isn't hypercapnia also a problem in this position?